… as counter-maps
The Flood Necklace (Loire River, France, 1800-2003)
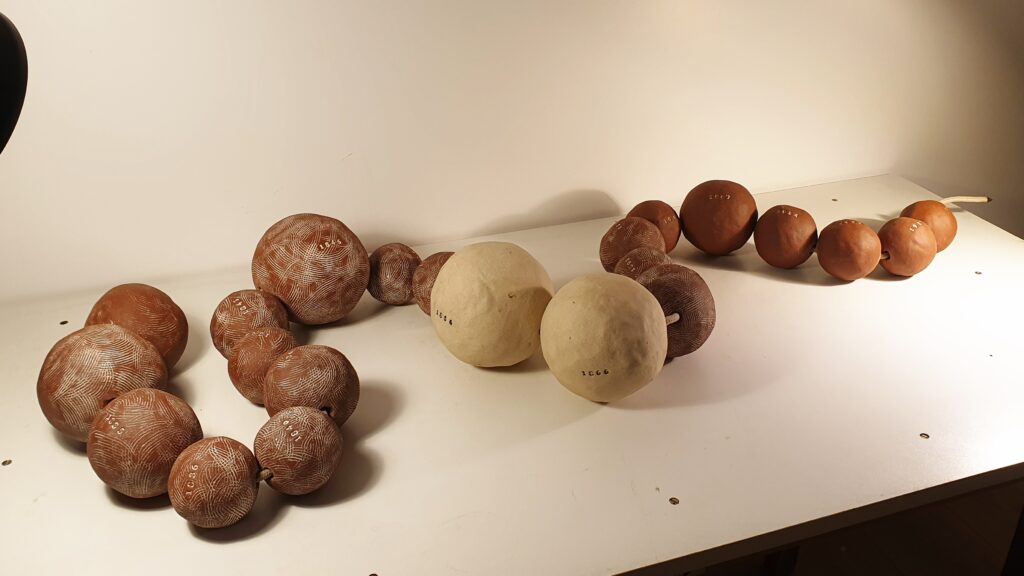
This project was inspired by a call for participation from the Journal of Creative Geography “You are here”, edited by the School of Geography of the University of Arizona for an issue about counter/cartographies. The Flood necklace datasculpture was submitted as a form of counter-mapping, both tactile and sensible, but also involving a slow-making process and another kind of relationship to the data and the river it concerns. Sculpting environmental data is a proposition to map geographical entities that go around the “from above” and “far away” traditional views to open new ways of re-embedding time and materiality into cartographies.
How to tell one river’s or mountain’s story without reducing it to its physical, mechanical and “only now” dimension has become an act of counter-mapping, an act of considering that what we call “the environment” has a historical thickness, has changed and moved for centuries, that places are inhabited and can’t be understood through the only perspective of naturalism and its exploitative, extractive counterpart. The Flood Necklace is the first piece of a datasculpture series that depicts the history of the Loire River by water heights since 1800.
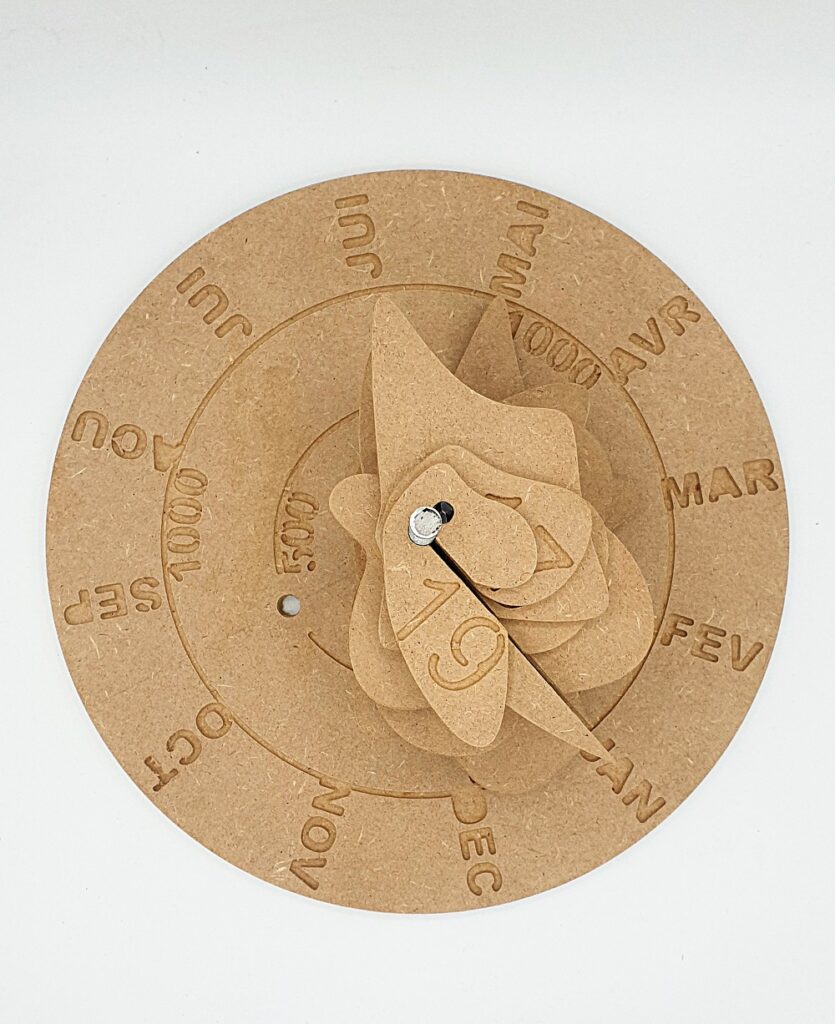
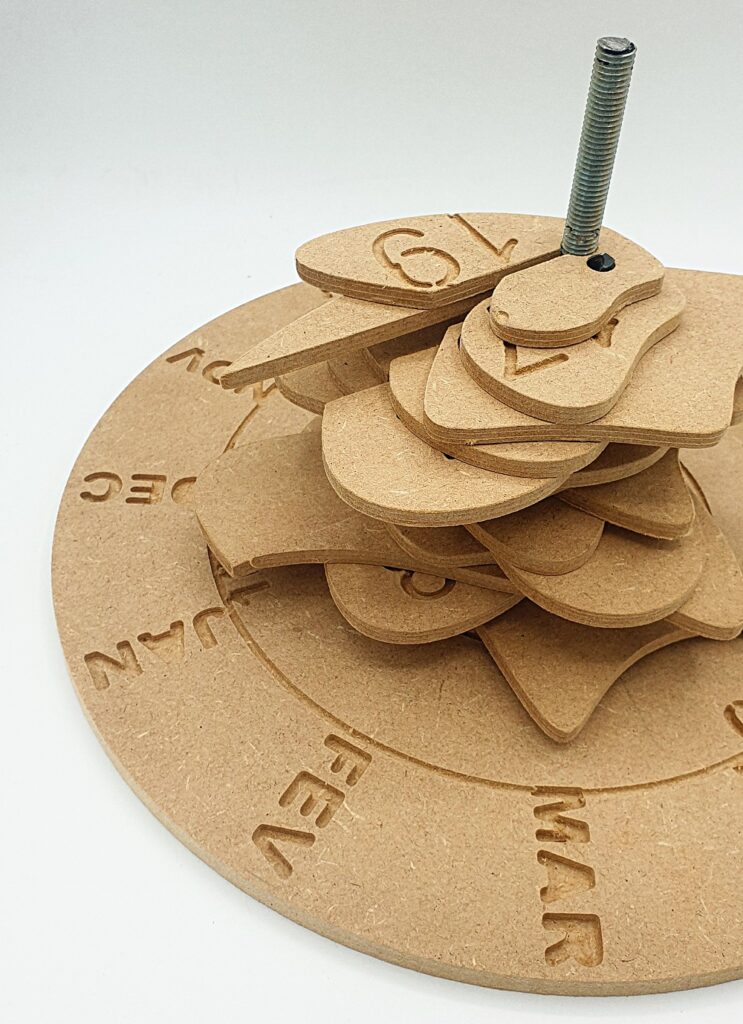
Loire’s RIVER FLOW HISTORY (monthly data 1960-2022)

From the previous datasculpture “The Flood Necklace” as a first counter-map proposition, and after discussing with geologist and stratigraphist Zoltan Sylvester about his 3D river meandering model through time, emerged the question of how to give, in one glance, a physical and visual representation of the complete history of one’s river.
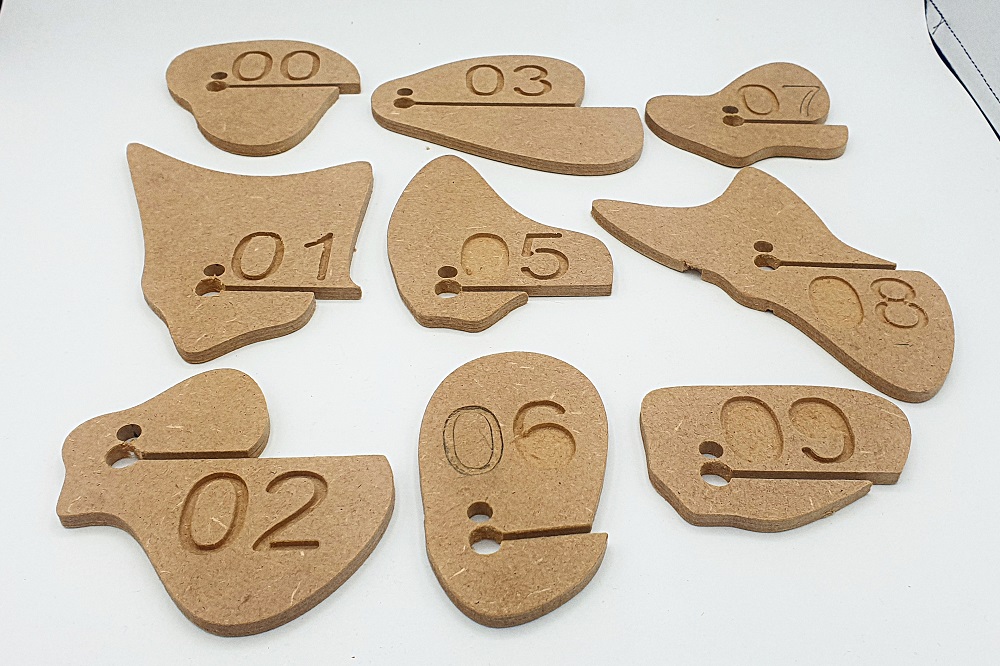
It is a common bias in the field of stratigraphy to focus more on the biggest events, as they left quite visible and interesting sediments behind, than it is to study centuries of regular, mundane water flows, that are also trickier to read with precision.
I wanted to reflect on that bias and think about what a full history of the Loire River could look like by focusing on regular monthly water heights instead of major flooding events. The two sculptures together would carry two different sets of data but complement each other as counter-map propositions carrying knowledge about water heights’ history.
Read more on the Datartefact research notebook: